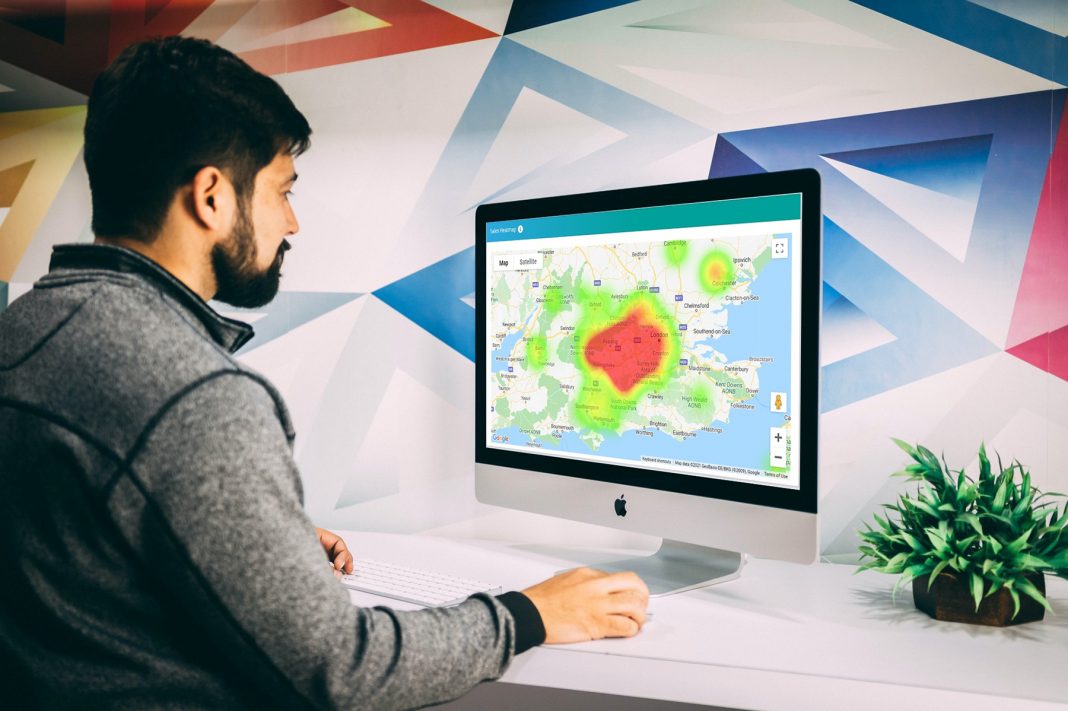
Business Pilot has launched new map functionality that lets users see which areas provide the best potential for new seeking business.
A zoomable heat map allows installers to identify which geographical areas deliver the best returns, highest values and conversion rates, colour coding hot spots and representing them by location.
Director Ryan Schofield explained: “The map shows you the geographical areas that deliver most sales and value to your business. This gives you the option of retargeting them because they deliver more conversions or applying resource to target other areas, which may be under exploited.
“For companies with a proactive approach to lead generation it’s a very effective way of seeing where your hit rates are highest.”
The new resource also helps users to pinpoint each sales appointment, survey or installation geographically, giving a visual reference for teams’ location and activity.
Ryan contiued: “We’ve taken information that already exists within the system and laid it over a series of maps. That makes that information far more accessible.
“It’s an instant visual reference tool. If you want to know where your fitting teams are or how close they are to one another because you need to split the team to bring more support onto a job, you can see at a glance where everyone is. It’s the same for remedial work; you can see instantly who you can pull off a job based on location.”
Each job is represented by a different coloured pin. These can be filtered to show only certain or a single area of activity, for example surveys. To get more information about each job, the user hovers over the pin to pull up job details including who is on site, the address and who the customer is.
For fitting, sales and installation teams it also includes a time and distance to site reference and confirmation status, allowing them to plan their visits more effectively. This can also be accessed through a new map view from Business Pilot’s drag and drop schedule board with everything instantly updated as and when any changes are made.
The sales heat map sits as part of Business Pilots new Sales and People & Sales Dashboards, launched as part of a major revision of its management information dashboard in May.
This allows installers to understand the cost of acquisition of each lead and to track how it progresses, including the performance of individual members of their sales team – and now geographical location – in a visual reference.
“Everything is linked”, added Ryan. “The maps, our new Status Progression tool, the management information dashboard – each element connects to the other and changes are automatically carried across. Giving you an instant overview in real time of each element of your business, allowing you to plan more effectively in the short and long term”, he concluded.
www.businesspilot.co.uk


